Contents - Index - Previous - Next
Charts and Graphs
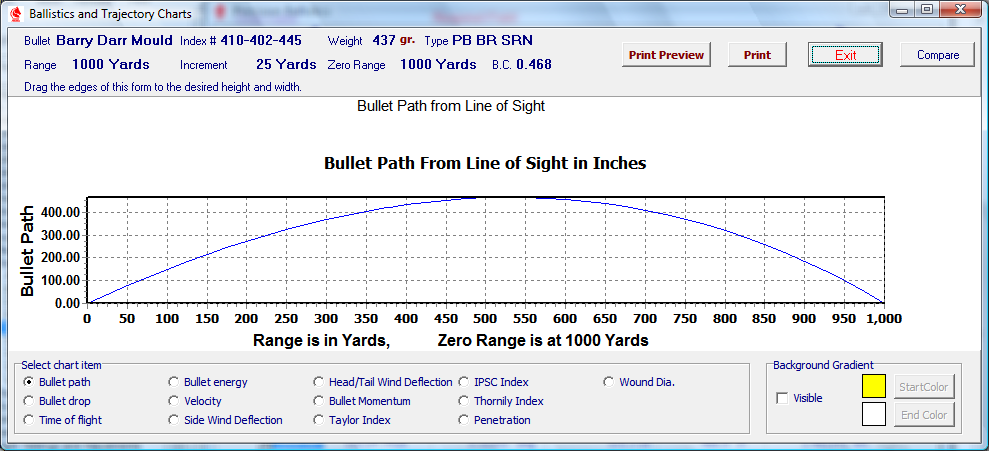
The Ballistics and Trajectory Graphing Module provides a visual concept of the bullet path in relation to the Line Of Sight. The graph is, of course, not to scale relative to bullet height and range distance, but the cursor may be placed at the edges of the graph and, while holding down the left mouse button, the graph may be lengthened or shortened both vertically and horizontally in order to gain a closer perspective.
When setting up the Initial Data, with the intention of viewing the Bullet Path Chart, use a small incremental range value to insure a smooth curve as the software draws a straight line from point value to point value.
The Background Gradient component contains all properties used to draw a nice Chart background.
The gradient effect is made of two colors and many middle transition colors between them.
The Visible checkbox controls if the gradient will be displayed or not. Use the Start Color and End Color properties to change the gradient colors.
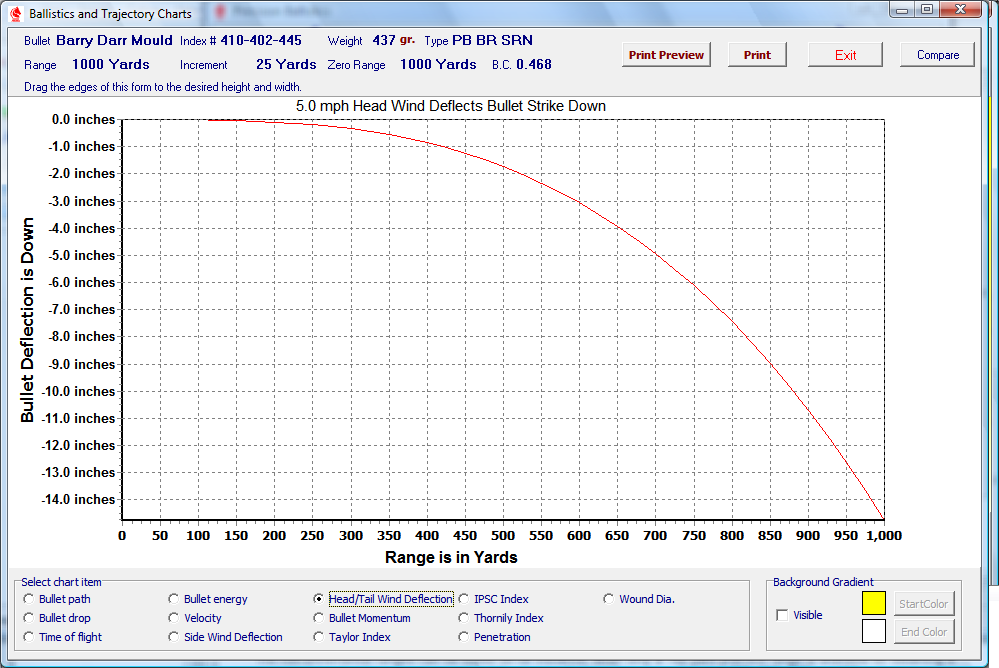
In addition to Bullet Path graphing, each of the radio buttons in the "Select Chart Item" group box will open a chart which graphs that particular aspect of the bullet trajectory.
Clicking the "Compare" button will open the Compare Trajectory Values module where the ballistic concepts of various loads from the same or different firearms may be visually compared.
Copyright 2002-2010. TMT Enterprises. All rights reserved.